Transform Your Analytics Experience
Centralise all your analytics assets in one powerful portal. From Power BI to Tableau, from datasets to dashboards - everything your organisation needs, exactly where you expect to find it.

Everything your organisation needs for unified analytics discovery.
Unified Discovery
Navigate reports and datasets across multiple platforms through a single, intuitive interface
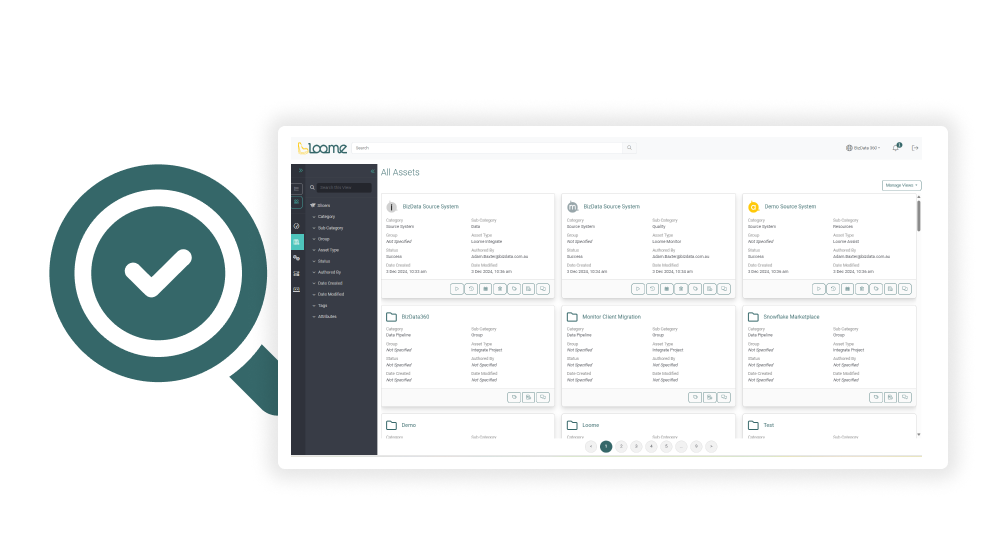
Smart Classification
Organize analytics assets by business area and subject matter for intuitive access

Why Organisations Choose Loome for Analytics Ops
Accelerate
Time to Insight
- Find the right analytics assets instantly
- Reduce duplicate report creation
- Enable self-service analytics discovery
Strengthen
Governance
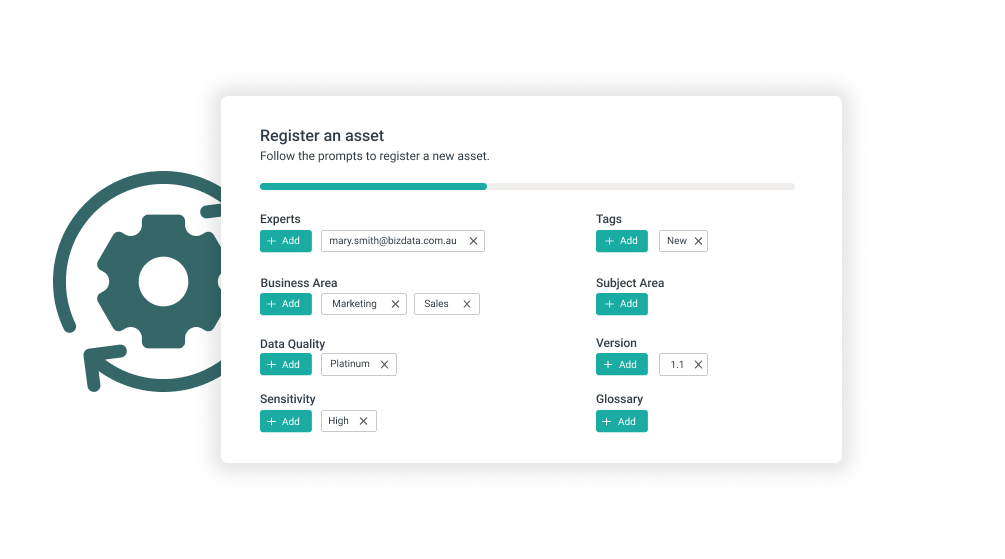
- Enforce metadata standards
- Control publishing workflows
- Track usage and adoption metrics
Drive
User Adoption
- Simplified user experience
- Customized portal branding
- Integrated business glossary
Start your free trial and see how Loome transform fragmented analytics into an organised analytics ecosystem
Driving User Adoption
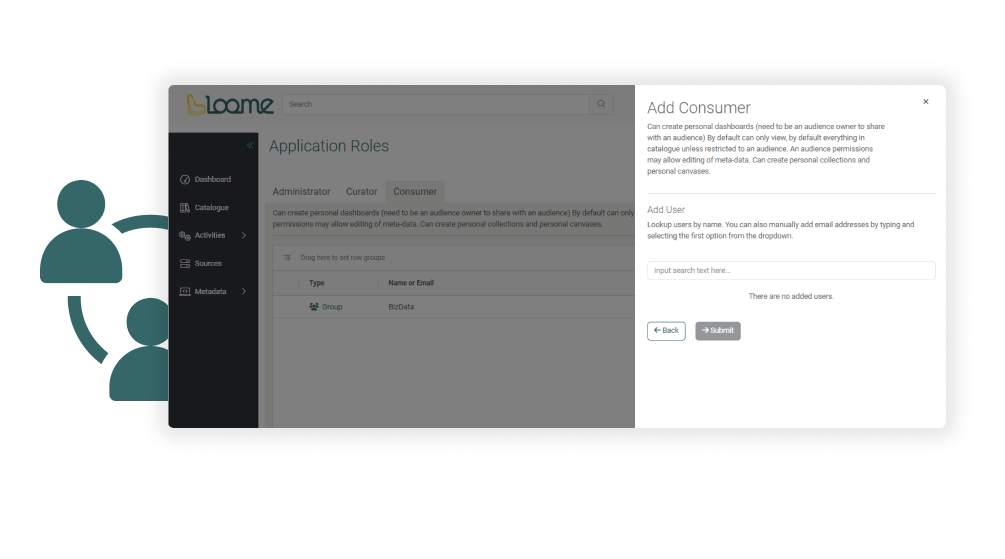
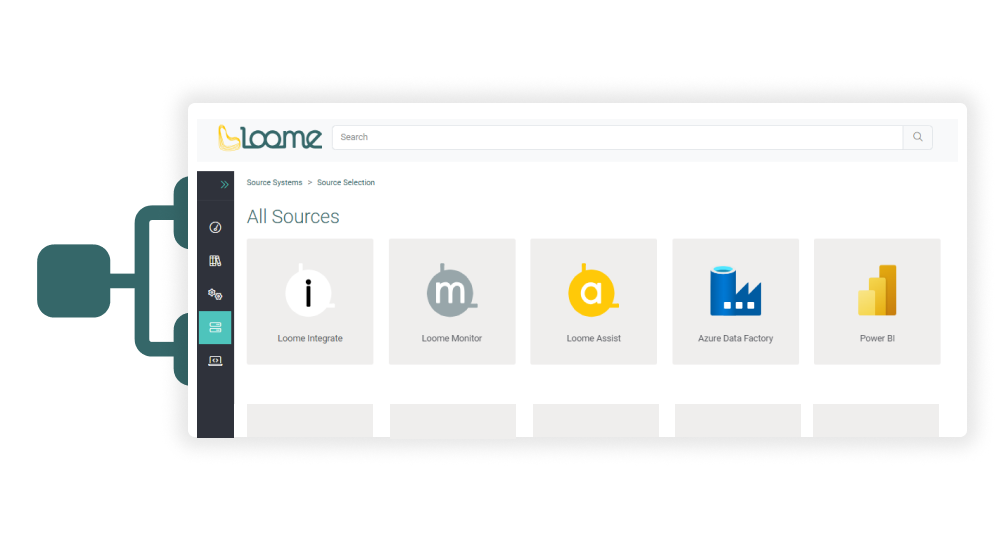
A unique catalogue and user portal for analytics
Drive a better user experience by providing a portal across all of your analytics tools.
With Audience Targeting you can hone in on the right audience for the right collection of reports without having to save copies of reports to different folders.
Driving User Adoption
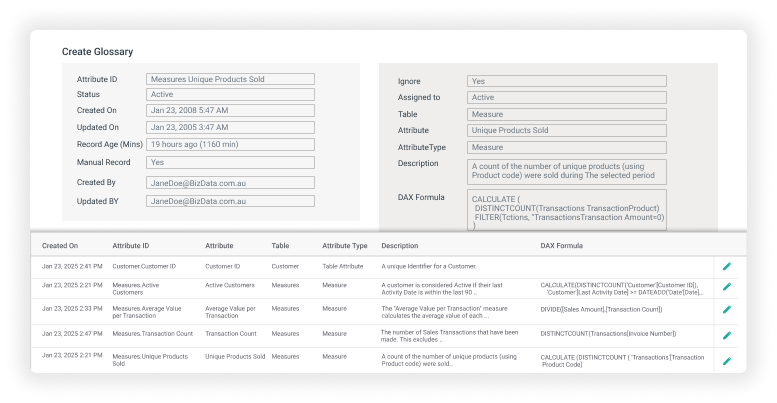
A comprehensive data glossary
Loome allows you to present data definitions in situ within your dashboards and reports, providing greater transparency and eliminating the need to access different tools.
Driving User Adoption
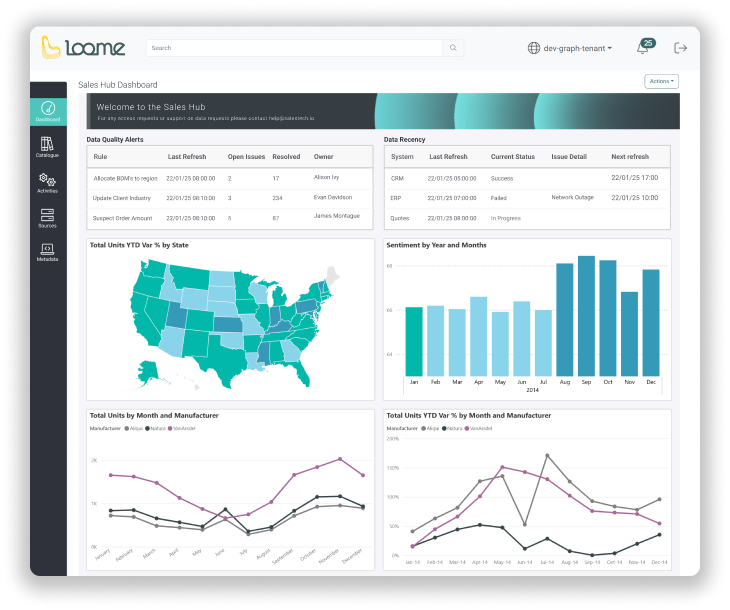
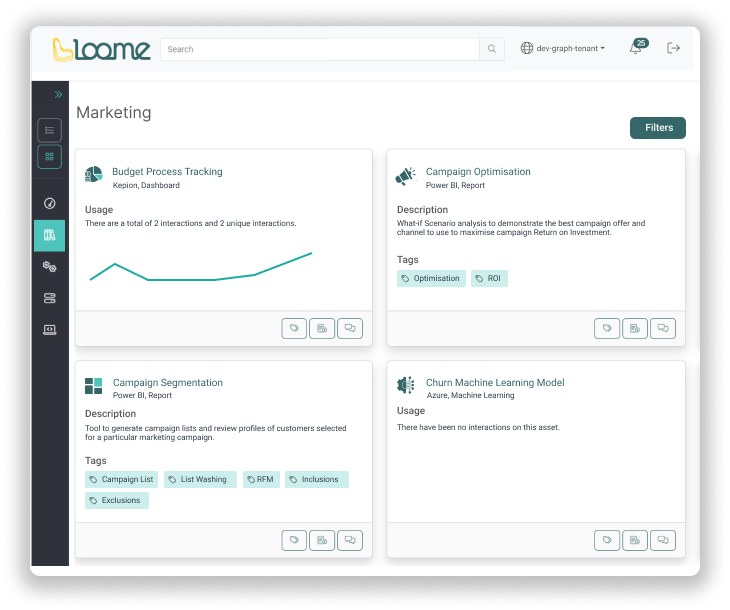
Customised Dashboards
You can create different dashboards for different audiences to highlight key content relevant to particular audiences, as well as mashup multiple visualisation tools in the one screen.
Use prebuilt dashboards or build your own which highlight the recency and quality data used for decision making.